Thursday, January 15, 2015

Asia the largest e-commerce market in 2015

Taken from tech.firstpost.com

Asia to become world’s largest e-commerce market in 2015

Asia is set to surpass North America to become the world’s largest e-commerce market this year, according to the Economist Intelligence Unit (EIU).

According to a report in Beijing by the EIU Tuesday, an advisory company under the Economist magazine group, it is estimated that retail sales in Asia will grow by an average 4.6 percent on a volume basis to $7.6 trillion, compared with 2.5 percent in North America and 0.8 percent in Europe in 2015.

The Asian consumer market was largely driven by the rising independence and economic power of Asia’s women, and female consumers in Asia are showing an unprecedented enthusiasm for online shopping. 

The report comes in the backdrop of huge demand for e-commerce generated in China by platforms like Alibaba which is picking up at a rapid pace in India.

The two countries together account for about three billion people.

The EIU report is based on a survey of 5,500 women across major cities on the Chinese mainland, Hong Kong, Taiwan and Macao, as well as countries including India, Japan, Singapore and the Republic of Korea.

Among the survey respondents, 43 percent were in managerial, executive or professional services jobs.

Nearly half of the women agreed or strongly agreed that they preferred online to in-store shopping.

The proportion on the Chinese mainland was as much as 69 percent. Sixty-three percent of those polled browsed the Internet at least once a day for products and services, with nearly 30 percent doing so twice or more per day.

When choosing an online retailer, price and quality were the main factors considered, followed by genuine products and convenience.

---

As Internet use matures globally, annual growth in eCommerce between businesses and consumers will slow, settling at about 10% by 2018, according to eMarketer, which says such B2C sales will reach $1.47 trillion in 2014, up 20 percent from last year.

By 2018, the company projects, the total will reach $2.36 trillion, a 61 percent boost over the 2014 year-end projection and $200 billion in annual new dollars spent. eMarketer defines B2C eCommerce as sales that include all products and services ordered or booked via the Internet on any device, including leisure and unmanaged business travel.

Regionally, the combined spending of the U.S. and Canada will remain on top in B2C eCommerce sales this year, representing about one-third of the dollars spent on digital purchases worldwide, the company said in its forecast report. It previous had predicted that Asia-Pacific would surpass North America in market share, but it changed that view because of unanticipated slower growth in China’s B2C eCommerce spending caused by market maturation.

“With China accounting for a significant portion of eCommerce sales in Asia-Pacific, this affected our estimates materially,” the research company said. Instead, eMarketer expects the region to take the global lead in B2C eCommerce sales next year, when it will achieve a 33.4 percent share to North America’s 31.7 percent and Western Europe’s 24.6 percent.

“These three regions combined will continue to take around 90% of the global eCommerce market throughout our forecast period,” eMarketer said.

A growing base of digital buyers will help boost eCommerce sales in Asia-Pacific, as more new buyers come online. However, by 2018, nearly 70% of Internet users in both Western Europe and North America will purchase items on digital devices compared with just more than 50 percent in Asia-Pacific, eMarketer said.

“Buyer penetration in Asia-Pacific translates to the largest number of consumers, but the region is far more fragmented than North America and Western Europe,” the company noted. “In the latter two regions, eCommerce continues to grow at double-digit rates and will do so for several more years.”

In such large markets, this illustrates that individual buyers are making purchases more frequently and with higher order values, and consumer behaviors are relatively consistent across countries in both regions, the company said.

However, across Asia-Pacific countries, consumer behaviors are more disparate. China alone will make up more than half the region’s eCommerce sales this year, jumping to 70 percent by 2018, eMarketer said, which noted Australia and Japan rival markets like the U.S., UK and Western Europe in buyer penetration and average order values.

“On the other hand, in less-mature markets like India and Indonesia, there are large absolute numbers of digital buyers, but many are new to the market,” the company said. “Instead of buying high-ticket items, new digital buyers tend to wet their feet with less costly purchases due to product availability or simply to income constraints.”

A report published last month during the Global E-commerce Summit in Barcelona found Europe B2C eCommerce last year grew by 16.3 percent year over year to €363.1 billion (US$486.1 billion). The report predicted 17.2 percent growth this year, to €425.5 billion, eventually growing to €625 billion by 2016. The European e-commerce figures were compiled with various national eCommerce associations and in cooperation with GfK.

The growth is going to accelerate due to higher spending in mature countries and increase of the number of transactions in emerging markets, the report found.

e-Commerce on Social Media (SocialCommerce)

Taken from The Internet Retailer

2015 Social Media 500

Meet the 500 Masters of Social Marketing
& Commerce in 2015

As consumers continue to spend more of their online time on social networks (according to comScore Inc., the networks claim 20% of daily attention spans), and as those networks roll out advertising formats with unparalleled targeting capabilities, e-retailers are massively stepping up their social media marketing, and Internet Retailer’s latest research shows that these moves are paying off. Indeed, the 500 leading social media marketers in the U.S. and Canada are fine-tuning their social media marketing and commerce initiatives to maximize their impact on their bottom lines. They collectively grew their social commerce sales in 2014 by 26.0% to $3.30 billion, up from $2.62 billion—well ahead of the growth rate of e-commerce overall in the U.S. (16.9% in 2013 according to the Department of Commerce)—according to the data in the just-released 2015 Social Media 500. As a whole, the data show these 500 e-retailers:

• Boosted their Facebook Likes in 2014 by 33% to 915.7 million
• Grew their Twitter following by 26% to 88.6 million followers
• Increased their number of Pinterest followers by 16% to 34.7 million; and
• Drove 78% more video views on YouTube for a total of 3.89 billion.

---

Taken from pymnts.com

SOCIAL COMMERCE RETAIL SALES UP 26%

While retailers fight the crowded social media space to get their voice heard by consumers, a new report says social media is playing a larger role in retailers e-commerce strategies.

Data from Internet Retailer’s 2015 Social Media 500 shows that total social commerce sales reached $3.30 billion in 2014, which was up 26% from 2013’s $2.62 billion. Retailers also saw an average growth of 5.4 percent in 2014 in terms of total site traffic from social networks. The data also shows that those visitors are more likely to purchase once they click on a retailer’s site from a social network.

But driving that traffic isn’t cheap.

“Merchants are having to spend more on ads to have their content seen by consumers. That’s because Facebook shows fewer of a brand or retailer’s posts to its fans now than it did a few years ago, a strategy that effectively forces marketers to spend more on advertising to reach Facebook users,” wrote Stefany Zaroban for Internet Retailer.

Organic reach is getting harder for retailers, so they are having to turn to social media to help market their brand. A report from social analytics vendor Socialbakers said, on average, only 25 percent of companies are able to reach its customer base through organic posts. And in Internet Retailer’s research, of the 43 e-retailers that reported its social ad budgets, their total budgets were up 144 percent in 2014 to $17.9 million a month.

Data from the report also indicated that retailers have placed a large focus in increasing their social media audience. In 2014, those surveyed said their collective number of Facebook “likes” grew 33 percent in 2014; Twitter grew by 26 percent; Pinterest followers grew by 16 percent; and YouTube views grew by 78 percent.

Personalized Digital Channel Marketing

Taken from emarketer.com

Offline Personalization Matters Just as Much
Marketers who personalize offline most likely to see lift in conversions
January 14, 2015

There’s been plenty of talk about personalizing online communications, such as email, but recent research suggests it’s equally important to tailor offline customer experiences as well.

According to September 2014 research by Econsultancy in association with RedEye, 95% client-side marketers worldwide who had implemented personalization via offline channels had seen an uplift in conversion rates. This was more than any digital channel studied, and led email—the most popular personalization channel—by 5 percentage points. Among digital channels, websites and search engine marketing (SEM) were most likely to have seen lifts in conversion due to personalization, with the latter tops across all channels for driving “major” uplift.


However, those polled weren’t exactly focusing on the most successful channels. Just 23% of client-side marketers worldwide personalized offline channels, compared with 88% who used email personalization and 44% who did so for websites. Agency professionals were even less likely to tailor offline efforts, at just 17%. One-fifth of respondents personalized SEM—the second-lowest response for both marketers and agencies.

Econsultancy’s findings are another reminder of the need for retailers to provide an omnichannel experience. While digital and mobile are no doubt part of the purchase path, most final buying decisions still happen in-store. Retailers who can tie all of the data collected on a customer stand a better chance at closing the deal.


But many face a long road ahead in doing this. In a study by Retail Systems Research for SPS Commerce, released in September 2014, just 5% of US companies believed they had made advanced progress in executing an omnichannel strategy, compared with 37% who said they were lagging.


Pajak untuk bisnis OTT, mungkinkah jadi dilemma ?


Diacu dari Bisnis Indonesia
OTT Asing Sulit Dikenai Pajak

Otoritas perpajakan Indonesia dan tekanan negara besar dinilai menjadi penghalang niat BRTI untuk mengenakan pajak terhadap pelaku OTT asing.
Pengenaan pajak atas penghasilan iklan pelaku OTT merupakan salah satu solusi untuk memberi keadilan ekonomi bagi Indonesia. Selain itu, Amerika Serikat, berkepentingan agar pemain OTT yang mayoritas bercokol di negeri itu tidak dibebani pajak oleh negara lain.
OTT dan operator jaringan telah menjadi permasalahan di AS. Pada tahun lalu, Federal Communications Commission (BRTI-nya AS) sempat mewacanakan agar penyedia jasa Internet bisa memungut tarif kepada pelaku OTT. Kebijakan ini, jika diluluskan, membuat akses Internet terhadap server OTT menjadi berbeda sesuai dengan tarif yang dibayar. Namun, rencana tersebut ditolak oleh presiden yang bersikukuh negaranya tetap menerapkan asas net neutrality sehingga kecepatan akses terhadap konten apapun sama sesuai bandwidth.
ITU juga seiya-sekata dengan negara-negara besar, hanya China dan Korea Selatan yang berhasil mengendalikan OTT. Pemerintah China melarang penyedia konten asing masuk ke jaringannya. Sementara Korea Selatan menarik pungutan kepada OTT dengan dalih perbedaan aksara Korea dengan internasional.
(Samdysara Saragih)

Investasi Telkom di ICT & MEDIA


Diambil dari situs BeritaSatu.com


Investasi Bisnis Contact Center

Telkom sudah masuk pasar Australia dan Selandia Baru dengan mengakuisisi 75 persen saham Contact Centres Australia Pty Ltd (CCA), perusahaan yang bergerak di solusi business process outsourcing (BPO) yang berbasis di Sydney, Australia.
Telkom mengakuisisi CCA melalui anak usahanya, Telekomunikasi Indonesia International Australia Pty Ltd, dengan nilai transaksi Aus$ 11 juta. Aksi akuisisi tersebut rampung pada 25 September 2014.
Sebagai informasi, CCA adalah salah satu perusahaan contact center terbesar di Australia yang memiliki dua anak usaha, yakni Financial Information Services Pty Ltd, yang berkantor pusat di New South Wales, Australia serta Contact Center New Zealand Ltd di Wellington, Selandia Baru.

Investasi Bisnis e-Commerce

eBay Inc, perusahaan jual beli online asal Amerika Serikat (AS), berencana menambah kepemilikan saham pada PT Metra Plasa menjadi 49 persen dari sebelumnya 40 persen.
Saat ini, sebanyak 60 persen saham Metra Plasa dikuasai oleh PT Telekomunikasi Indonesia Tbk (Telkom/TLKM). Dengan begitu, kepemilikan Telkom pada Metra Plasa bakal berkurang menjadi 51 persen
Semula, Telkom melalui anak usahanya, PT Multimedia Nusantara, sepakat membentuk perusahan baru bersama eBay dengan kepemilikan masing-masing sebesar 60 persen dan 40 persen. Pembentukan Metra Plasa tersebut sejak April 2012.
“eBay bisa menambah menjadi 49 persen. Mereka juga punya opsi untuk menjadi mayoritas. Ada tahapan menuju ke sana, mereka inginnya cepat. Tapi saya belum bisa disclose,” kata Indra, belum lama ini.
Metra Plasa pada awalnya mengelola situs belanja online Plasa.com. Dengan menggandeng eBay, Telkom akhirnya mengembangkan situs belanja bernama blanja.com.
Menurut Indra, sejak 2012, eBay telah mengucurkan dana sekitar US$ 9,2 juta pada Metra Plasa. Telkom pertama kali berinvestasi pada plasa.com pada 2009 sekitar US$ 5 juta. Dengan demikian, total investasi Telkom dan eBay dalam mengembangkan situs belanja online sekitar US$ 14,2 juta. Per September 2014, aset sebelum eliminasi Metra Plasa sekitar Rp 68 miliar.
Ke depan, kata Indra, eBay berpeluang menambahkan investasinya ke Metra Plasa. Strategi menggandeng eBay membuat Telkom belajar terkait platform serta cross border trading. Nantinya, sistem eBay memungkinkan barang yang terdaftar pada blanja.com dijual ke luar negeri. Saat ini, situs blanja.com memiliki total 1 juta produk terdaftar, 600 penjual, serta 50.000 pengunjung per hari.

Thursday, January 08, 2015

The most important emerging trends in digital media and emerging technology for 2015

Taken from Harvard Business Review's article
The Tech Trends You Can’t Ignore in 2015
Amy Webb
JANUARY 5, 2015

The trend was analyzed from consumer behavior, microeconomic trends, government policies, market forces, and emerging research within the context evolving tech and digital media ecosystem.

Then the analysis framework combines with The Five Questions:
1. Where/how are people wasting their time?
2. Where/how are people having difficulty with technology?
3. Where/how are people looking for information?
4. Where/how are people stuck?
5. How do people want to be perceived?

Here are the six of 2015 trends that offer great opportunity – along with some unusual new challenges – for managers in all industries:

1. Deep learning: Artificially intelligent computers are now capable of deep learning using neural networks, which you can think of as brain-inspired systems capable of translating pixels into English. Toward the end of 2014, Google researchers unveiled a new project that uses neural networks and deep learning to identify multiple elements of a scene without human assistance. Its software “learned” how to think by processing vast quantities of data. For example, deep learning will eventually allow robots to recognize objects they haven’t seen before and navigate to new locations on their own. Deep learning intersects with numerous fields, and it will soon aid in manufacturing, medicine, retail, utilities, and beyond.

2. Smart virtual personal assistants: SVPAs started entering the market in 2013. At the time, they used semantic and natural language processing; data mined from our calendars, email, and contact lists; and the last few minutes of our behavior to anticipate the next 10 seconds of our thinking. Most of those original apps have now been acquired. Emu was acquired by Google, Donna was acquired by Yahoo, Cue was acquired by Apple…and the list goes on. When it was still active, Emu was a clever stand-in for a personal secretary. It would monitor the conversation and automatically make suggestions as two people texted. For example, if you asked your friend to see a movie, Emu would immediately geolocate both of you, suggest a nearby theater and show films and times, then check your calendars for your availability. It would even display a preview for you to watch. Once it determined the best time for you to meet, it would help you purchase tickets and enter all the data into your calendar. And it did all of this inside a single mobile application. In 2015, consumers will begin to see SVPA technology baked into their mobile phones. For example, Google is quietly starting to release a new SVPA function for Android users: it automatically detects when you’ve parked your car, marks your parking spot for you on a Google map, and helps get you back to it once you’re ready to start driving again. All without you explicitly asking it to do so. Marketers, credit card companies, banks, local government agencies, political campaigns, and many others can harness SVPAs to both deliver critical information and to better read and understand constituents.

3. “It’s like Uber for ____”: In spite of harsh criticism about its business practices, 2014 was a banner year for Uber. With a $40 billion paper valuation, the simple app connecting drivers to passengers is now worth more than Halliburton Corporation, Aetna, General Mills, Delta Airlines, Kraft Foods, and Charles Schwab. Uber’s fast growth is due to lightning-fast consumer adoption, and that’s because Uber does two things very well. First, it monetizes downtime. For professional drivers, Uber is a fast, easy way to find riders. It’s also been a boon for people who’ve lost their jobs, offering them a way to make money when other jobs are hard to find. Second, Uber provides a seamless payment interface. Riders don’t need to carry cash or even a credit card, as the entire transaction is handled via a simple mobile interface. Uber’s success has inspired hundreds of other entrepreneurs who want to emulate the best features of the company. In 2015, expect to see lots of new, Uber-ish delivery and intermediary businesses, including fast grocery delivery, helicopter rides, portable ATMs, alcohol delivery, in-home massage service, dry cleaning and laundry, iPhone repair, personal shopping, medical marijuana, dog walkers, and on-site car mechanics. Meantime, consumers will respond to one-click transactions that process payments in the background – meaning there’s a great opportunity for established retailers, transportation companies, banks, and others to leverage what’s becoming standard consumer behavior.

4. Oversight for algorithms: In its essence, an algorithm is simply a set of rules or processes that must be followed in order to solve a problem. In the coming year, we will also begin questioning the ethics of how algorithms can be used, and we’ll scrutinize the tendency of some algorithms to go awry. Programmers are adding in subjective judgments to algorithms and allowing them to deliver answers. As a result, those in the big data space are increasingly misclassifying objects, data, and even people. There are numerous stories of algorithms wrongly identifying terrorism suspects at airports. High-frequency trading algorithms once nearly destroyed the stock market. A glitch in Amazon’s algorithm caused the price of The Making of a Fly: The Genetics of Animal Design to spike to $26,698,655.93. During the next several months, managers should discuss how to include accountability systems for algorithms.

5. Data privacy: Ongoing breaches have continued to dismantle the public trust. According to a Pew Internet and Society poll, 91% of Americans surveyed either agreed or strongly agree that consumers have lost control of their personal information and data. Whether it’s fear of a third party monitoring our mobile phone activity or concern about the safety of online transactions, people are increasingly concerned about their privacy, and they’re pointing the finger at business, not maleficent hackers. In 2015, businesses must not only work to meaningfully encrypt their data, but they must make a public showing of the measures they’re taking to safeguard our personal information. One new area of particular note in 2015: digital consent. Lawyers could soon use our personal data against us in court. Fitbit data, processed through a third-party analytics tool, was used in a courtroom late in 2014, around the same time that the FTC began investigating Fitbit’s practice of selling users’ 3 data to advertisers. We will see growing demands for digital consent agreements and increased transparency.

6. Block chain technology: The block chain is the transaction database that’s shared by everyone participating in bitcoin’s digital system. It’s how the crypto-currency promises complete anonymity while using a crowd-regulated public ledger system. Think of the block chain as a sort of distributed consensus system, where no one person controls all the data. Even if Bitcoin itself never really gains traction, block chain technology has enormous promise.  For instance, some people argue that a block chain system would have prevented the massive credit card breach at Target. A new company, Blockstream, plans to turn the block chain into a universal platform that can be used for anything requiring signatures or authentication. It would let people participate in “trustless” transactions, where buyers and sellers work with an intermediary like an escrow manager, a trustee, or other middlemen.

In some way, each of these tech trends will affect your business in the coming year. The best way to prepare for coming disruption is to learn as much as you can, discuss implications with others in your company, and then commit to launching small experiments internally to help you see the trends in motion.

IoT Security & Privacy Concern

Taken from CIO-Today's article:

Internet of Things Growing Despite Security Concerns
December 30, 2014

Chances are you'll hear a lot more about the Internet of Things (IoT) in 2015 -- and it might not all be good. Although IoT is clearly gaining momentum, consumers are concerned about privacy and security.

Nearly 65%  of American consumers are moderately or extremely interested in adopting smart home solutions, according to new research from the Internet of Things Consortium (IoTC). And 71% buy it based on word-of-mouth referrals from people they trust or in-store employee recommendations.

Security Threats Emerge

That said, two-thirds of respondents are concerned about privacy. In fact, across age, gender and income, 66% of survey respondents express concern about privacy. Researchers say this finding highlights the need for industry participants to mitigate privacy and security concerns to drive the industry forward.

Good News for Advertisers

Despite these concerns, respondents are still pressing into IoT. 37% of survey respondents want to be able to enhance their home entertainment experiences by transferring shows and content from one device to another. The same percentage of respondents also wants to control their home appliances using a voice assistant.

In welcoming news for marketers, U.S. consumers said they would be open to viewing advertisements on connected home devices. Over a third said they would be willing to accept commercial advertising if it helped subsidize the cost of connected home products or services.


January 5, 2015

The International Consumer Electronics Show (CES) 2015 event is seeing the debut of serious hardware and software for business plus a focus on tools for maintaining data privacy and security, and management tools for the emerging Internet of Things. 

Samsung Electronics and Daimler AG/Mercedes-Benz discussed the many possibilities being created by the fast-evolving Internet of Things, while Mercedes-Benz is expected to talk about autonomous driving, meaning self-driving cars.

IoT 'Everywhere'

The Internet of Things, which encompasses networked devices ranging from smart thermostats to cellphone-controlled door locks and ultra-small micro-electromechanical systems, is expected to generate $300 billion in product and service revenues by 2020. The number of IoT devices likely to be deployed by then will reach around 26 billion units.

Sunday, January 04, 2015

Nielsen's Advertising Strategies

Taken from SharedThis blog:
Shared Conversations Series with Randall Beard
By Matt Wolfrom on September 03, 2014

Randall delves into innovative ad strategies to succeed in today’s fragmented media industry, the transformational nature of marketing organizations and the value of leveraging quality data to increase your advertising effectiveness.

Developing ad strategies in the current multi-screen landscape.

Today, creating an effective advertising strategy is complicated due to an incredibly fragmented industry, especially with the rise of new forms of media like social, mobile, tablet, etc.

The challenges that advertisers are facing in an integrated multi-screen world:
1. It is important to measure not only how well your advertising reaches your intended audience, but also how much it resonates, changes brand preference and reaction. In other words, does it impact behavioral sales? We call this the three Rs: reach, resonance and reaction.
2. Clients want common metrics in measurement across platforms. Although every platform is unique, in order to have comparability to allocate spending appropriately across platforms, you have to have common measurement metrics. Simplify success metrics with three basic questions:
- How well are you reaching your intended audience?
- How well does your advertising resonate with that audience?
- How well does it drive a reaction?

“Better, not bigger, data.”

For years many digital measurements like page views and click through rates existed, but at the end of the day advertisers and agencies were left with one major question: who did my digital advertising reach?

The ability to measure audience delivery in digital with traditional panels was virtually impossible, so we  partner with Facebook, who has the largest panel in the world.

To make the data even better, we take it and compare it to our cross platform gold standard panel. Then we put it through a calibration engine to make sure it is really accurate.

Reach consumers and understand  behavior in today’s crowded marketplace

The reason digital audience measurement is so important is because advertisers, agencies and media companies want accountability. When an advertiser buys 30M impressions against women 20-29, they want some measurement and a guarantee to know whether or not the media company or publisher actually delivered.

Another approach is through real-time optimization — moving money from lower performing to higher performing sites. In terms of reaching consumers and understanding consumer behavior, that circles back around to the reach, resonance, and reaction model, and using reaction to be smarter about who you want to reach. Being able to optimize real-time allows users to maximize performance of a campaign while it’s still going on, and before ad dollars are wasted.

One of the things that we have developed is the ability to do single source — bringing together a measurement of what people watch, including the ads that they are exposed to, and what they buy at the household level. We have a panel of consumers where we know what they’ve been exposed to and what those people have purchased in store, based on other datasets. We then match those two at a household level, stripping out any personally identifiable information. This data is anonymized and privacy-protected.

Impending advertising singularity  

Singularity is when computers and artificial intelligence become smart enough to self-learn and smarter than humans. There is so much going on in the world of advertising and media and it is creating greater automation and optimization opportunities for advertising effectiveness.

Increasingly you’re able to measure individual level exposure to ads and then match that to consumption of purchase behavior. By looking at what people are exposed to and they’re buying, brands can measure the individual impact of every digital touch point. An advertiser that’s bidding for 10K search keywords could measure the individual impact of each of those 10K search keywords for online and offline sales.

These advertisers can also measure the impact of all combinations of touch points. Many platforms have machine learning capabilities where they continuously learn about what methods are more effective. They have the ability to plug into demand-side platforms and drive real-time bidding. This is individual-level measurement of advertising exposure that is connected to purchase behavior and all updated in real-time.

Excellent partnership and foster with digital partners

To stay on top of industry trends there are two ways approach, organizational and cultural.

From an organizational approach, we need capability to address cutting edge issues. Create an advertising effectiveness innovation lab in partnership with University.  

Fostering a culture that is open to experimentation and external partnerships to solve big important  problems is really important.

Marketing Trends

There are three areas that are really important:
1) Data. Marketing in general is much more data and evidenced base, and it is becoming much more of a science. To be clear, creative, big advertising and marketing ideas will always be the foundation for great marketing. However, the rise of data and evidence-based marketing is a big trend, and getting the finance function to begin seeing marketing as an investment, as opposed to a cost line in the income statement, is essential.
2) Real-time. There’s a growing need for people that have the ability to be adaptive and operate in the moment.
3) Technology. new capabilities are enabling expanded opportunities in marketing that were not possible before.

The main challenge is how to advertise in a truly cross-platform in an integrated way. We’ve been very focused on bringing new tools to advertisers and agencies that allow them to plan across platforms so they can maximize reach across TV and digital.

ADVERTISING TRUST

Taken from nielsen article:

GLOBAL TRUST IN ADVERTISING AND BRAND MESSAGES
04-10-2012

The voice of fellow consumers continues to be strongly heard when it comes to the most trusted forms of advertising. 92% of consumers around the world say they trust earned media, such as word-of-mouth or recommendations from friends and family, above all other forms of advertising—an increase of 18 % since 2007, according to study from Nielsen. Online consumer reviews are the second most trusted source of brand information and messaging, with 70%  of global consumers surveyed online indicating they trust messages on this platform, an increase of 15% in four years.

KEY TAKEAWAYS:

- Earned media sources remain most credible
- Trust in traditional paid advertising messages declines
- Confidence in online and mobile advertising increases
- Regional variances offer global marketers opportunities
- Improved relevance in advertising has room to grow

Nielsen’s Global Trust in Advertising Survey of more than 28,000 Internet respondents in 56 countries shows that while nearly half of consumers around the world say they trust television (47%), magazine (47%) and newspaper ads (46%), confidence declined by 24%, 20% and 25%, respectively, between 2009 and 2011.

Still, the majority of advertising dollars are spent on traditional or paid media, such as television. In 2011, overall global ad spend saw a seven percent increase over 2010, according to Nielsen’s most recent Global AdView Pulse. This growth in spend was driven by a 10% increase in television advertising, with countries including the U.S. and China, attracting more advertising dollars versus the year prior.

Randall Beard, global head, Advertiser Solutions at Nielsen said “Although television advertising will remain a primary way marketers connect with audiences due to its unmatched reach compared to other media, consumers around the world continue to see recommendations from friends and online consumer opinions as by far the most credible. As a result, successful brand advertisers will seek ways to better connect with consumers and leverage their good-will in the form of consumer feedback and experiences.”

In addition the survey found that relevancy results often mirrored trust responses, indicating there is room for improvement by marketers to make a more personal connection with consumers.

Digital Advertising

Taken from Investopedia article:
How The Internet Web Ad Industry Works
By Trevir Nath

Over the past 10 years, advertising strategies have evolved as a result of technological development. Commercials and print advertisements, which dominated advertising in the 20th century, have lost importance as the internet has provided new channels for advertisers to reach a larger audience. Gannett Company estimated in 2013 that the newspaper industry lost more than $1 billion in advertising, a 5.3 percent decrease from the prior year. The advertising industry has moved largely away from print advertising in favor of digital and web based advertisements.

Online marketing has grown and expanding containing a number of tools to reach consumers via the Internet. Areas of online marketing include, search engine optimization, social media marketing, and mobile advertising to name a few. While various forms of internet advertising exist to optimize sales, it is imperative for companies and advertisers to reach the highest rank on search queries within Google. Google (GOOG) has created Google AdWords and AdSense for advertisers to utilize in conjunction with other marketing strategies.

GOOGLE ADWORDS AND ADSENSE
A majority of Google’s revenue is generated from advertising. Google’s online advertising programs, AdWords and AdSense, generated $50 billion of Google’s $57 billion in revenue in 2013. Google AdWords is a marketing strategy for companies and advertisers to reach a larger audience. Appearing higher on a Google search query ultimately bodes well for new and established firms.

AdWords provides companies an opportunity to bid on the placement of an advertisement and keywords within Google’s website. Searches in relation to the business will result in the company’s advertisement and website appearing as a result of a search query. Google only generates revenue when advertisements are clicked. This is defined as cost per click and is a marketing strategy to direct traffic to a company website.

Likewise Google AdSense enhances a company’s opportunities to reach larger audiences through advertisements. Google places the advertisements within other websites to produce clicks rates and website traffic. Largely recognized for its search engine, Google generates a majority of revenue through advertising services for companies in search of enhancing website traffic.

SEARCH ENGINE OPTIMIZATION (SEO)
While Google AdWords and AdSense produce higher search results with a Google search result, there are organic means to similar results without spending money. Search engine optimization is a strategy to naturally increase the visibility and traffic of a website in a search engine.

SEO specialists must consider how search engines operate, keywords in a page's URL, and how consumers search. Incorporating a variety of SEO strategies to support a website can generate higher ranks in popular search engines resulting in increased traffic. Due to Google’s robust market share in search engines, advertisers customize their SEO efforts to Google’s search algorithms.

While optimizing a website for SEO isn't easy, companies may outsource their needs to firms that specialize in SEO. Typically, an SEO firm will analyze and audit features of a website such as keywords, Google Analytics reports and links. In order to optimize a website, an overhaul of coding, link building and a website redesign may be needed to create fresh content. As digital advertising and marketing strategies continue to develop, it has been suggested that search engine optimization may not always work in obtaining the highest search results.

SOCIAL MEDIA MARKETING
Success in internet advertising can be easily measured by the amount of website traffic a company generates. Social media encompasses tools which globally connect individuals to create and share information and experiences; not coincidentally, social media can be a huge driver of website traffic.

Though Facebook (FB) is often thought as the preeminent social media platform, there are many social media companies, both public and private, including Twitter (TWTR) and Instagram to name only the next largest two. (Instagram is owned by Facebook.) Due to the nature of social media, consumers are constantly connected with each other, and as a result advertisers can attract a larger audience with a relatively low-cost tweet, Facebook post or Instagram picture.

Social media marketing can be measured by impressions or engagement. Impressions measure the number of times an advertisement is seen even if it is not clicked. Marketers also measure the level of engagement between consumers and businesses. Engagement is a strategy in which consumers post new content and conversations within social media to drive website traffic and noise. As Millennials are deeply immersed in social media, advertisers believe that social media marketing is the most effective digital channel.

MOBILE ADVERTISING
Over the past 10 years, mobile technology has made vast gains in innovation, design and service. It is Pew estimates that 90 percent of American adults own a mobile phone, and 58 percent of them own a smartphone as of 2014. As a result, mobile advertising has rapidly grown to the most effective channel in reaching a large audiences.

Mobile advertising is a form of advertising via smartphones including advertising formats such as display, video, social and search. Display and Video advertisements encompass advertisements located on websites. Display advertisements take the form of banners; whereas video advertisements are pre rolled ads and often reformat TV commercials. It is reported that mobile advertising is growing much faster than all other forms of digital advertisements with search and social media at the forefront of revenue. 

THE BOTTOM LINE
Ubiquitous internet access has enabled new advertising and marketing strategies to reach consumers. Google AdWords and AdSense create opportunities for companies to increase search rank at a cost. In conjunction with Google’s advertising programs, companies can increase web presence through search engine optimization, social media marketing, mobile advertising, and content marketing. Measuring success of internet advertisements can be done through search and web analytics which quantify a number of features including impressions and engagements. The development and sophistication of online marketing has proven to be quite successful with internet ad revenue exceeding $42.8 billion in 2013, marking a 17%  increase over the year prior.

Saturday, December 27, 2014

Facebook Ditinggal Anak Muda

Mirip dengan posting sebelumnya berjudul Facebook's older audience , artikel yang dikutip dari Marketeers.com juga mengulas tentang sosial media Facebook

PARA REMAJA MULAI BOSAN DENGAN FACEBOOK

Facebook merupakan jejaring sosial terbesar di dunia. Sampai Juni 2014 tercatat pengguna Facebook mencapai lebih dari 1,3 milliar pengguna di seluruh dunia.

Pertumbuhan Facebook bisa dibilang sangat pesat. Ketika pertama kali didirikan pada tahun 2004, Facebook baru memiliki jumlah pengguna sebanyak 1 juta. Hanya dalam tempo satu dekade Facebook sudah meraup lebih dari 1 milliar pengguna.

Bagaimana dengan di Indonesia? Hingga September 2014, Facebook memiliki sekitar 69 juta pengguna di Indonesia. Namun begitu, di negara ini, walaupun setiap tahunnya ada pengguna baru sesungguhnya pengguna aktif Facebook mengalami penurunan.

Temuan studi GlobalWebIndex yang melibatkan 170 ribu responden di 32 negara menemukan bahwa pengguna aktif Facebook secara total mengalami penurunan. Berdasarkan riset GlobalWebIndex,  statistik pengguna Facebook yang masih berkirim pesan kepada teman-temannya mengalami penurunan.

Pada kuartal pertama 2013 masih ada sekitar 512 juta pengguna, namun bila dibandingkan kuartal pertama tahun 2014 terjadi penurunan sekitar 20%. Di kuartal pertama tahun 2014 jumlah pengguna Facebook menjadi 402 juta. Angka ini terus menurun sampai kuartal ketiga tahun 2014. Hingga kuartal ketiga tahun ini, pengguna Facebook yang masih berkirim pesan kepada rekan-rekannya melorot hingga 313 juta.

Penurunan ini terjadi pada para pengguna Facebook yang masih usia masih remaja. Temuan GlobalWebIndex mendapatkan 64% remaja sudah jarang aktif di Facebook. Bahkan, 50% kelompok remaja menganggap Facebook tidak semenarik dahulu. Sebagian dari mereka juga beranggapan bahwa Facebook dianggap membosankan, sehingga para remaja mulai mengurangi waktu penggunaan jejaring sosial tersebut.

"Ada sentimen tertentu terhadap produk buatan Facebook, meskipun kebanyakan orang sudah terbiasa dengan produk Facebook, namun sebagian lainnya mulai bosan," ujar Head of Trends GlobalWebIndex Jason Mander di jakarta (25/11/2014)

Selain alasan-alasan tersebut juga beberapa alasan lainnya yakni mereka lebih tertarik menggunakan aplikasi seperti Instagram dan Path yang lebih privat dan aplikasi berbagi pesan seperti WhatsApp, WeChat dan Line. "Polanya, orang merasa tidak nyaman untuk membagi informasi seputar keseharian mereka di jejaring sosial. Mereka beralih ke aplikasi mobile messaging karena mereka menilai hal itu lebih aman dan bisa dikontrol," ujar Jason.

Namun yang menarik adalah aplikasi Facebook Messenger sampai November 2014 berhasil meraih lebih dari 500 juta pengguna aktif semenjak pertama kali diluncurkan pada agustus tahun 2011. Facebook memisahkan layanan berbagi pesan melalui smartphone  dari aplikasi utama Facebook sejak Agustus 2014. Untuk itu, para pengguna yang ingin berbagi pesan kepada sesama rekan harus mengunduh Facebook Messenger terlebih dahulu.

Selain Facebook Messenger, Facebook juga memiliki aplikasi lainnya seperti WhatsApp dan Instagram. Instagram dibeli oleh Facebook senilai US$ 1 milliar pada tahun 2012, yang saat ini sudah memiliki lebih dari 200 juta pengguna. Sedangkan WhatsApp dibeli oleh Facebook pada Februari 2014 dengan nilai US$ 19 milliar. Saat ini WhatsApp memiliki lebih dari 600 juta pengguna.

US mobile ad spend profile

Taken from Business Insider's article

Mobile Advertising Is Exploding And Will Grow Much Faster Than All Other Digital Ad Categories
MARK HOELZEL DEC. 22, 2014

Mobile is growing faster than all other digital advertising formats in the US, as advertisers begin allocating dollars to catch the eyes of a growing class of “mobile-first” users.

Historically, there has been a big disparity between the amount of time people actually spend on their smartphones and tablets (significant and growing), and the amount of ad money spent on the medium (still tiny).

But BI Intelligence expects that this gap will narrow substantially, as enthusiasm grows for mobile-optimized ad formats (such as interactive rich media and native ads), as targeting improves, and more and more advertisers learn how to effectively use the platform.

New data from BI Intelligence finds that US mobile ad spend will top nearly $42 billion in 2018, rising by a five-year CAGR of 43% from 2013.

Here are some of the key takeaways:

Display and video will be the fastest-growing mobile ad formats as digital ad dollars quickly shift from desktop to mobile, and ad products improve. US mobile display and mobile video ad revenues will grow at an astonishing CAGR of 96% and 73%, respectively, between 2013 and 2018.

But search and social media will still account for the largest share of  US mobile ad revenue during the forecast period. Search is a strong format on mobile because of its convergence with local-mobile targeting.

Mobile programmatic ad revenues, including ads sold through real-time bidding (RTB), will account for 43% of US mobile display-related ad revenue in 2018, up from only a 6% share in 2013. But programmatic will still be limited by the lack of robust cookie-based targeting on mobile (Red: maybe it could enhance with mobile subscriber profile from operator?).

In-app mobile ads perform much better than mobile web ads, and ad spend will likely follow performance and usage. In-app click-through rates averaged 0.56% globally compared to 0.23% for mobile web ads during the first half of the year, according to Medialets.

Microsoft on Nook Business

Taken from Business Insider's article
How Microsoft Turned $300 Million Into $116 Million
MATT ROSOFF DEC. 4, 2014

Barnes & Noble and Microsoft have dissolved their joint venture, and Barnes & Noble is buying back all shares in the joint venture for $62 million in cash and stock worth about $54 million, according to a new SEC filing (Red:Total $116 Million ?).

That leaves Microsoft with a loss of about $238 million on the deal (Red:from $300 Million minus $62 Million ?). It also gives Barnes and Noble a cleaner exit if it wants to spin off the Nook business.

It also relieves Microsoft of certain obligations, like paying for operating expenses related to the venture.

The joint venture kicked off in April 2012 when Microsoft invested $300 million for a 17% stake in Barnes & Noble. The companies announced the deal with a lot of fanfare, but the details were always vague — they built a Nook app for Microsoft's Windows 8 operating system, and earlier this year, they said they were working on something called a "Microsoft Consumer Reader," which may have been a new kind of e-reading app. It never emerged.

The deal also ended a lawsuit between the companies.

Since the early 2000s, Microsoft has been approaching companies to license its patents the company believes are being violated. Many companies, including a lot of Android resellers, have agreed, and Microsoft may be earning more than $2 billion a year from these licenses.

But Barnes & Noble initially refused to take a license for its Nook reader, which was based on Android. And in the subsequent lawsuit, it started talking about some of the details of the negotiations with Microsoft, like its demands for between $5 and $15 per device, and the precise patents that Microsoft claimed were being infringed.

The joint venture made that lawsuit go away. So even if Microsoft never got much else out of the deal, one could argue that paying a couple hundred million to keep its patent licensing program cranking along was a pretty good bargain.

Tuesday, December 23, 2014

Instagram effect for Facebook

Taken from Bloomberg's article
Facebook Shares Rise to Record on Mobile Growth, Instagram
By James Callan and Kelly Gilblom
December 22, 2014

Facebook shares rose to a record as the social network caps a year in which mobile advertising increased and marketing initiatives expanded with applications and video.

The shares advanced 2 percent to $81.45 at the close in New York, the highest price since Facebook’s initial public offering in May 2012. The stock has jumped 49% in 2014, compared with a 12 percent gain in the Standard & Poor’s 500 Index.

This year Facebook made further headway in mobile, a business that has flourished from a minor portion of ad revenue at the time of the IPO to a majority. Facebook’s acquisition of Instagram in 2012 has also been paying off.

Facebook’s stock has more than doubled since the IPO and the company has a market value of $227.8 billion.

Surpassing Twitter
The Citigroup analyst, said he reached his $35 billion valuation for Instagram based on faster-than-expected user growth and increased revenue from advertising. The estimate puts Instagram in the same realm as American Airlines Group Inc., with a market capitalization of about $36.5 billion, and Kraft Foods Group Inc., at about $37.9 billion.

It’s been about a year since Instagram started making advertising available, as Facebook CEO Mark Zuckerberg starts monetizing the app’s audience and data assets. Instagram’s monthly active users rose to 300 million this month, giving it more users than Twitter Inc., which said it had 284 million in October.

Mobile Growth
Sales are projected to surge 46 percent to $3.78 billion in the fourth quarter, according to the average of analysts’ estimates compiled by Bloomberg. Mobile promotions accounted for 66% of ad sales last quarter, up from 62 percent in the prior period and 59 percent in the first quarter, the company said in October.

Marketers have also been paying more for fewer ads. Higher-quality ads, improved targeting and premium video advertising, led Menlo Park, California-based Facebook to more than triple prices for promotions in the last quarter compared with a year earlier.

Facebook is projected to take 8% of the $140.7 billion global ad market this year, up from 5.8 percent last year, according to EMarketer.

Facebook's older audience

8Taken from Bloomberg's article
Facebook’s Popularity Among Teens Dips Again
By Sarah Frier
December 19, 2014

Facebook Inc. (FB) is getting less and less cool, at least among teens.

A report yesterday by Frank N. Magid Associates Inc. found that the portion of 13- to 17-year-old social-media users in the U.S. on Facebook slipped to 88% this year from 94 percent in 2013 and 95% in 2012. In the same period, Twitter Inc. and messaging applications rose in popularity in that age group, the study showed.

The Menlo Park first warned a year ago that teens weren’t using its website as often as before. Facebook stopped discussing teen usage on its earnings calls after last year’s disclosure alarmed investors. While the issue was all but forgotten as the company’s advertising revenue reached new highs, it’s a bigger concern now.

ADVERTISEMENT
“You look at Facebook and you say, ‘Wow, something really changed in 2014, If kids are starting to use so much of their daily time on messaging apps, surely it’s going to hurt somebody.”

Among 13- to 17 year-olds, Twitter usage climbed 2 percentage points to 48%, according to the report.

While more people use Facebook and its messaging app than any competitor, its user base tends to be older, with 55% of Facebook Messenger users being 37 or younger. By the same measure, 86% of Snapchat users and 83% of Kik Interactive Inc.’s users are under 37. Facebook sought to buy Snapchat in 2013 for more than $3 billion, and was rebuffed.

Trust, Fun
One reason for the decline in teen Facebook usage is due to concerns that the service may not be trustworthy. Just 9% of those surveyed described the website as “safe” or “trustworthy,” while almost 30% of people said they would use those words to describe Pinterest. Pinterest also ranked higher in “fun,” with 40% saying so compared with 18% for Facebook, as did Instagram, which Facebook owns.

Instagram Gains
Facebook CEO Mark Zuckerberg has been working to diversify the company’s offering beyond the main Facebook application. He acquired Instagram, the photo-sharing application, in 2012 for less than $1 billion. This year, Facebook also purchased messaging application WhatsApp Inc. for about $18 billion.

The Instagram purchase is showing gains, with Citigroup Inc. estimating the app is worth $35 billion, due to its faster-than-anticipated user growth. Instagram is especially popular among younger users, too.

Though Facebook has said it is in no rush to make money off of the app, Instagram CEO Kevin Systrom has been taking steps to make the service more appealing to advertisers. The company recently started eliminating spam accounts, wiping off large portions of fake followers for celebrities on the service such as Justin Bieber, which some have dubbed an “Instagram Rapture.”

“Not only is Instagram’s audience now larger than Twitter, but its users are about 1.8 times more engaged, and user growth has been greater,” Mark May, an analyst at Citigroup, wrote in a note. “Instagram is at the early stages of rolling out advertising, but we believe brands have and will find it an effective channel.”

Sunday, December 21, 2014

M2M : Electricity and Gas Smart metering in Europe

Taken from Berg's Report 


EU28+2 has 281 million metered electricity customers and the annual demand for electricity meters for new installations and replacements is in the range of 12–16 million units. Penetration for smart meters, providing more comprehensive functionality than basic meter data collections, was 24 % at the end of 2014. By 2020, Berg Insight projects that the penetration rate will increase to 58 %, driven by large rollouts in Spain, France and the UK, in combination with nationwide rollouts in several smaller countries. The installed base of smart electricity meters is forecasted to grow at a CAGR  of 15.8 % between 2014 and 2020 to reach 163.8 million units at the end of the period. The rate of installations is expected to accelerate towards the end of the decade as nationwide rollouts in France and eventually also the UK get underway. Berg Insight also anticipates that deployments of a new generation of smart meters will start in Italy by circa 2020 as the first intelligent metering devices installed in the country reach the end of their technical lifespan. Moreover an uptake in adoption in Germany is likely, although full-scale installations cannot be expected to begin before the mid-2020s.

Europe’s national governments play a key role for the adoption of smart metering. The EU’s highly publicised 20/20/20 targets merely include a recommendation for the member states to evaluate the technology and introduce it – if there is a positive business case. Over the past years, almost all European countries have performed cost benefit analyses of smart metering and the majority of the cases have resulted in a recommendation to go ahead with a rollout. Italy and Sweden were the first countries in Europe to complete smart meter rollouts in the late 2000s, followed by Finland at the end of 2013. A second wave of deployments is now prepared or underway in France, the Netherlands, Spain, the UK and several other countries in Western Europe. Estonia is doing the first nationwide rollout in Eastern Europe, where other markets with a high level of activity also include Poland and Latvia. At the end of 2014, a total of seventeen European countries had developed regulatory roadmaps for the full-scale introduction of smart meters and at least two more were planning for partial rollouts. Among the largest countries, only Germany remains indecisive about smart meters. The official position of Germany’s federal government is that the country should design the roll-out of smart metering systems in a targeted fashion which meets the needs of its energy reforms. A proposed plan for a partial rollout to around 30 percent of the households is currently being evaluated. If approved, Berg Insight believes that it could result in a gradual ramp-up of smart meter deployments in the late 2010s and full-scale replacements beyond 2020.

Smart gas metering is starting to take off in Europe as a number of countries have identified a positive business case for the technology. Seven countries – Austria, France, Ireland, Italy, Luxembourg, the Netherlands and the UK – have made positive assessments in their national cost benefits analyses and plan full-scale rollouts. The Netherlands made the installation of smart gas meters mandatory for new connections and replacements in 2012 and the UK has also started with replacements on a small scale. During 2015, large-scale installations are planned to begin in France and Italy as well. At the end of 2014, there were 2.5 million smart gas meters in operation, corresponding to a penetration rate of around 2 %. By 2020, Berg Insight projects that the rate will increase to 40 %, mainly driven by nationwide rollouts in the UK, Italy and France. The installed base of smart gas meters is forecasted to grow at a compound annual growth rate of 63.8 % between 2014 and 2020 to reach 49.0 million units at the end of the period. 

Mobile "currently" is taking over "almost" everything


Taken from eMarketers artcle's Digital Video Viewers Keep Eyes on PCs

Mobile hasn't taken over digital video

The US audience for digital video will pass 200 million in 2015, making up not quite two-thirds of the entire population. eMarketers estimate that growth will run in the low single digits over the next few years.


The most common screen for digital video consumption is the traditional desktop or laptop. Many digital video viewers use multiple screens over time (and even simultaneously), but computers remain the most popular access point. 

A survey of US internet users by HUB Research found that use of mobile devices (and smart TVs) for video viewing grew in 2014, but significantly more respondents still used computers to do so. Similar patterns can be seen in data from TNS, which found that laptop computers were the most common device used to stream videos. TNS’s survey showed a much smaller—but still significant—gap between computers and other devices for video viewing.


Another view, this from server data gathered by Adobe, in Q1 2014, almost three-quarters of US digital video starts occurred on computers, while just over one-quarter occurred on mobile devices. eMarketer estimates that there will be 89.7 million smartphone video viewers in the US in 2014. That total is about half the size of the overall digital video audience.

Although there are fewer tablet users than smartphone users, the size of the US tablet video-viewing audience is nearly as large as that of the smartphone video-viewing audience, reflecting the fact that the tablet is associated with leisure-time activities such as content consumption.

This year, about 46% of US households will have some form of connected TV (defined as a TV set connected to the internet through built-in internet capability or through another device such as a Blu-ray player, game console or set-top box—e.g., Apple TV, Google Chromecast, Roku). And by next year, nearly 56% of households will have at least one connected TV.

While the size of the mobile audience is considerable, the numbers also point to how nonmobile video—computers and connected TV—is still going strong. That’s essential to keep in mind when planning and executing ad campaigns to balance against the hype that “mobile is taking over everything.”

----

Related with that, another article from the same source, tell us a China market

China Beats US for Mobile TV Episode Viewing
Over 70% of China's smartphone owners watch full TV shows on their phones at least weekly

Mobile users in China are far more likely than those in the US to turn to their devices for TV viewing, according to August 2014 polling by GfK for the Interactive Advertising Bureau (IAB). The study found that 71% of smartphone owners in China watched full-length TV episodes at least weekly on their advanced handsets, and 27% did this once a day or more, compared with respective response rates of 28% and 9% for the US. Less than 10% of respondents from China never watched on a smartphone, compared with half in the US.


Full-length show consumption on tablets was also much more popular in China, where more than three-quarters of users watched at least weekly, compared with 36% who did so in the US. In terms of daily usage, 23% of tablet owners in China viewed full television episodes on their devices once a day or more, compared with just 5% in the US. Tablet owners in China were even less likely than smartphone users to never watch full shows on their tablets, at 6%. Meanwhile, 37% of US tablet owners never viewed complete episodes on their devices—lower than the response for smartphones, but still far behind China. Full-episode watching isn’t the only television activity that’s more mobile in China than the US. IAB reported that China’s mobile owners were more likely than those in the US to conduct TV-related activities in general on their devices, at least at home. Nearly half (47%) of smartphone users in China had performed a TV-related activity or watched TV on their phones while at home in the month leading up to polling, and the majority (54%) of tablet owners in the country had done the same. Meanwhile, rates for the US came in at 30% and 43%, respectively.

(Red : Maybe it has a correlation with device Operating System, that maybe most of people in China using Android based tablet or smartphone that have many free app to watching TV activities compared with people in US that use IOS based smartphone or tablet.)


Monday, December 15, 2014

Indonesia "still" The Leading Country for Digital Ad Spending Growth


This posting is updated the previous posting on August 2014,
Indonesia The Leading Country for Digital Ad Spending Growth

eMarketer's current update release a few days ago,
APAC Digital Ad Spending to Jump Over 30% This Year
Dec-2014

China dominates digital ad market; Indonesia sees most impressive growth

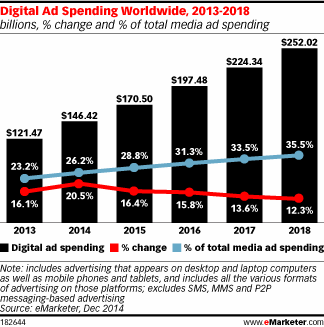
Digital advertising spend in Asia-Pacific is expected to rise 30.3% to total $46.59 billion this year, according to eMarketer’s latest estimates of digital ad spending worldwide. (red: previously it is expected to $41.07 billion, though the number of growth seems to be inconsistent)


Just like in 2012 and 2013, the region will boast the second-biggest share of digital ad spending worldwide, trailing only North America, at 31.8% vs. 37.3% (correction from 29.3% vs. 38.8%). This trend will continue through 2016, though Asia-Pacific will gain share during that period at the expense of North America. In 2017, Asia-Pacific will pass North America in total digital ad spending share worldwide, at 36.9% vs. 35.7%.

With investments in online and mobile advertising totaling $23.70 billion this year (updated from $18.96), China will maintain the largest share of the region’s digital ad market, at 50.9% (updated from 46.2%)—a trend that will continue through 2018. Japan and Australia will rank second and third, with respective digital ad spending totals of $9.07 billion and $4.52 billion this year, eMarketer estimates.


In Asia-Pacific, Indonesia will be the leading country for digital ad spending growth by a long shot, at a whopping 98.0% this year (updated from 75%). Indonesia sits at the bottom when it comes to digital ad spending, as brands there still heavily invest in traditional media like TV and print. However, as internet and smartphone adoption continue to grow rapidly, marketers will continue to switch ad spend to digital channels. Over the course of the forecast period, eMarketer expects the country to surpass India and South Korea in digital ad dollars by 2016 and 2018, respectively.

China will also see impressive digital ad spending growth of 45.0% this year, which will be mainly driven by phenomenal gains in the country’s mobile ad market. According to eMarketer’s latest estimates, marketers will spend $6.39 billion on mobile ads in China in 2014, up 600.0% from just $913.0 million last year.

$24Billion for Indonesia's Broadband Expansion

taken from the Reuters.com's article

Telkom to lead Indonesia's $24 billion broadband expansion
FRANSISKA NANGOY AND EVELINE DANUBRATA
JAKARTA Thu Dec 11, 2014 


(Reuters) - State-owned telecom firm PT Telekomunikasi Indonesia Tbk will take the lead in a $24 billion drive to expand Indonesia's broadband capacity over the next five years.

Rudiantara said the government is considering extending unspecified incentives to the company as it seeks to improve Internet access in Southeast Asia's largest economy. "I'm in the position to support Telkom to take a lead on this broadband plan," he told Reuters. The government is in the process of finalizing the details of the plan, he added.

Only 12%  of Indonesia's total population had access to mobile broadband last year, and that was at a relatively slow speed of 512 kbps , according to ministry data. For fixed line broadband, access was even lower at 5% of the total population.

Faster Internet and better access would give a boost to Indonesia's nascent e-commerce market, which the minister estimated could more than double to $25 billion by 2016 from around $12 billion this year.

Rudiantara said the government was discussing incentives with local e-commerce companies such as PT Tokopedia, but he declined to give further details. In October, Japanese technology giant SoftBank Corp and U.S. venture capital firm Sequoia Capital announced a $100 million investment in Tokopedia.

The minister also said the government was considering new regulations for the telecom industry to deal with an anticipated wave of consolidation as companies.  Rudiantara said he expects the number of telecom operators in Indonesia to more than halve to four in the next decade.

A price war to gain subscribers over the last few years and the high operating costs have squeezed the profits of telecom firms including Telkom, PT Indosat Tbk and PT XL Axiata Tbk. XL Axiata, part of Malaysia's Axiata Group Bhd, acquired mobile phone operator PT Axis Telekom Indonesia for $865 million earlier this year. In October, XL Axiata said it will sell 3,500 towers to telecom infrastructure firm PT Solusi Tunas Pratama Tbk in a 5.6 trillion rupiah ($460 million) deal.