Saturday, December 27, 2014

Facebook Ditinggal Anak Muda

Mirip dengan posting sebelumnya berjudul Facebook's older audience , artikel yang dikutip dari Marketeers.com juga mengulas tentang sosial media Facebook

PARA REMAJA MULAI BOSAN DENGAN FACEBOOK

Facebook merupakan jejaring sosial terbesar di dunia. Sampai Juni 2014 tercatat pengguna Facebook mencapai lebih dari 1,3 milliar pengguna di seluruh dunia.

Pertumbuhan Facebook bisa dibilang sangat pesat. Ketika pertama kali didirikan pada tahun 2004, Facebook baru memiliki jumlah pengguna sebanyak 1 juta. Hanya dalam tempo satu dekade Facebook sudah meraup lebih dari 1 milliar pengguna.

Bagaimana dengan di Indonesia? Hingga September 2014, Facebook memiliki sekitar 69 juta pengguna di Indonesia. Namun begitu, di negara ini, walaupun setiap tahunnya ada pengguna baru sesungguhnya pengguna aktif Facebook mengalami penurunan.

Temuan studi GlobalWebIndex yang melibatkan 170 ribu responden di 32 negara menemukan bahwa pengguna aktif Facebook secara total mengalami penurunan. Berdasarkan riset GlobalWebIndex,  statistik pengguna Facebook yang masih berkirim pesan kepada teman-temannya mengalami penurunan.

Pada kuartal pertama 2013 masih ada sekitar 512 juta pengguna, namun bila dibandingkan kuartal pertama tahun 2014 terjadi penurunan sekitar 20%. Di kuartal pertama tahun 2014 jumlah pengguna Facebook menjadi 402 juta. Angka ini terus menurun sampai kuartal ketiga tahun 2014. Hingga kuartal ketiga tahun ini, pengguna Facebook yang masih berkirim pesan kepada rekan-rekannya melorot hingga 313 juta.

Penurunan ini terjadi pada para pengguna Facebook yang masih usia masih remaja. Temuan GlobalWebIndex mendapatkan 64% remaja sudah jarang aktif di Facebook. Bahkan, 50% kelompok remaja menganggap Facebook tidak semenarik dahulu. Sebagian dari mereka juga beranggapan bahwa Facebook dianggap membosankan, sehingga para remaja mulai mengurangi waktu penggunaan jejaring sosial tersebut.

"Ada sentimen tertentu terhadap produk buatan Facebook, meskipun kebanyakan orang sudah terbiasa dengan produk Facebook, namun sebagian lainnya mulai bosan," ujar Head of Trends GlobalWebIndex Jason Mander di jakarta (25/11/2014)

Selain alasan-alasan tersebut juga beberapa alasan lainnya yakni mereka lebih tertarik menggunakan aplikasi seperti Instagram dan Path yang lebih privat dan aplikasi berbagi pesan seperti WhatsApp, WeChat dan Line. "Polanya, orang merasa tidak nyaman untuk membagi informasi seputar keseharian mereka di jejaring sosial. Mereka beralih ke aplikasi mobile messaging karena mereka menilai hal itu lebih aman dan bisa dikontrol," ujar Jason.

Namun yang menarik adalah aplikasi Facebook Messenger sampai November 2014 berhasil meraih lebih dari 500 juta pengguna aktif semenjak pertama kali diluncurkan pada agustus tahun 2011. Facebook memisahkan layanan berbagi pesan melalui smartphone  dari aplikasi utama Facebook sejak Agustus 2014. Untuk itu, para pengguna yang ingin berbagi pesan kepada sesama rekan harus mengunduh Facebook Messenger terlebih dahulu.

Selain Facebook Messenger, Facebook juga memiliki aplikasi lainnya seperti WhatsApp dan Instagram. Instagram dibeli oleh Facebook senilai US$ 1 milliar pada tahun 2012, yang saat ini sudah memiliki lebih dari 200 juta pengguna. Sedangkan WhatsApp dibeli oleh Facebook pada Februari 2014 dengan nilai US$ 19 milliar. Saat ini WhatsApp memiliki lebih dari 600 juta pengguna.

US mobile ad spend profile

Taken from Business Insider's article

Mobile Advertising Is Exploding And Will Grow Much Faster Than All Other Digital Ad Categories
MARK HOELZEL DEC. 22, 2014

Mobile is growing faster than all other digital advertising formats in the US, as advertisers begin allocating dollars to catch the eyes of a growing class of “mobile-first” users.

Historically, there has been a big disparity between the amount of time people actually spend on their smartphones and tablets (significant and growing), and the amount of ad money spent on the medium (still tiny).

But BI Intelligence expects that this gap will narrow substantially, as enthusiasm grows for mobile-optimized ad formats (such as interactive rich media and native ads), as targeting improves, and more and more advertisers learn how to effectively use the platform.

New data from BI Intelligence finds that US mobile ad spend will top nearly $42 billion in 2018, rising by a five-year CAGR of 43% from 2013.

Here are some of the key takeaways:

Display and video will be the fastest-growing mobile ad formats as digital ad dollars quickly shift from desktop to mobile, and ad products improve. US mobile display and mobile video ad revenues will grow at an astonishing CAGR of 96% and 73%, respectively, between 2013 and 2018.

But search and social media will still account for the largest share of  US mobile ad revenue during the forecast period. Search is a strong format on mobile because of its convergence with local-mobile targeting.

Mobile programmatic ad revenues, including ads sold through real-time bidding (RTB), will account for 43% of US mobile display-related ad revenue in 2018, up from only a 6% share in 2013. But programmatic will still be limited by the lack of robust cookie-based targeting on mobile (Red: maybe it could enhance with mobile subscriber profile from operator?).

In-app mobile ads perform much better than mobile web ads, and ad spend will likely follow performance and usage. In-app click-through rates averaged 0.56% globally compared to 0.23% for mobile web ads during the first half of the year, according to Medialets.

Microsoft on Nook Business

Taken from Business Insider's article
How Microsoft Turned $300 Million Into $116 Million
MATT ROSOFF DEC. 4, 2014

Barnes & Noble and Microsoft have dissolved their joint venture, and Barnes & Noble is buying back all shares in the joint venture for $62 million in cash and stock worth about $54 million, according to a new SEC filing (Red:Total $116 Million ?).

That leaves Microsoft with a loss of about $238 million on the deal (Red:from $300 Million minus $62 Million ?). It also gives Barnes and Noble a cleaner exit if it wants to spin off the Nook business.

It also relieves Microsoft of certain obligations, like paying for operating expenses related to the venture.

The joint venture kicked off in April 2012 when Microsoft invested $300 million for a 17% stake in Barnes & Noble. The companies announced the deal with a lot of fanfare, but the details were always vague — they built a Nook app for Microsoft's Windows 8 operating system, and earlier this year, they said they were working on something called a "Microsoft Consumer Reader," which may have been a new kind of e-reading app. It never emerged.

The deal also ended a lawsuit between the companies.

Since the early 2000s, Microsoft has been approaching companies to license its patents the company believes are being violated. Many companies, including a lot of Android resellers, have agreed, and Microsoft may be earning more than $2 billion a year from these licenses.

But Barnes & Noble initially refused to take a license for its Nook reader, which was based on Android. And in the subsequent lawsuit, it started talking about some of the details of the negotiations with Microsoft, like its demands for between $5 and $15 per device, and the precise patents that Microsoft claimed were being infringed.

The joint venture made that lawsuit go away. So even if Microsoft never got much else out of the deal, one could argue that paying a couple hundred million to keep its patent licensing program cranking along was a pretty good bargain.

Tuesday, December 23, 2014

Instagram effect for Facebook

Taken from Bloomberg's article
Facebook Shares Rise to Record on Mobile Growth, Instagram
By James Callan and Kelly Gilblom
December 22, 2014

Facebook shares rose to a record as the social network caps a year in which mobile advertising increased and marketing initiatives expanded with applications and video.

The shares advanced 2 percent to $81.45 at the close in New York, the highest price since Facebook’s initial public offering in May 2012. The stock has jumped 49% in 2014, compared with a 12 percent gain in the Standard & Poor’s 500 Index.

This year Facebook made further headway in mobile, a business that has flourished from a minor portion of ad revenue at the time of the IPO to a majority. Facebook’s acquisition of Instagram in 2012 has also been paying off.

Facebook’s stock has more than doubled since the IPO and the company has a market value of $227.8 billion.

Surpassing Twitter
The Citigroup analyst, said he reached his $35 billion valuation for Instagram based on faster-than-expected user growth and increased revenue from advertising. The estimate puts Instagram in the same realm as American Airlines Group Inc., with a market capitalization of about $36.5 billion, and Kraft Foods Group Inc., at about $37.9 billion.

It’s been about a year since Instagram started making advertising available, as Facebook CEO Mark Zuckerberg starts monetizing the app’s audience and data assets. Instagram’s monthly active users rose to 300 million this month, giving it more users than Twitter Inc., which said it had 284 million in October.

Mobile Growth
Sales are projected to surge 46 percent to $3.78 billion in the fourth quarter, according to the average of analysts’ estimates compiled by Bloomberg. Mobile promotions accounted for 66% of ad sales last quarter, up from 62 percent in the prior period and 59 percent in the first quarter, the company said in October.

Marketers have also been paying more for fewer ads. Higher-quality ads, improved targeting and premium video advertising, led Menlo Park, California-based Facebook to more than triple prices for promotions in the last quarter compared with a year earlier.

Facebook is projected to take 8% of the $140.7 billion global ad market this year, up from 5.8 percent last year, according to EMarketer.

Facebook's older audience

8Taken from Bloomberg's article
Facebook’s Popularity Among Teens Dips Again
By Sarah Frier
December 19, 2014

Facebook Inc. (FB) is getting less and less cool, at least among teens.

A report yesterday by Frank N. Magid Associates Inc. found that the portion of 13- to 17-year-old social-media users in the U.S. on Facebook slipped to 88% this year from 94 percent in 2013 and 95% in 2012. In the same period, Twitter Inc. and messaging applications rose in popularity in that age group, the study showed.

The Menlo Park first warned a year ago that teens weren’t using its website as often as before. Facebook stopped discussing teen usage on its earnings calls after last year’s disclosure alarmed investors. While the issue was all but forgotten as the company’s advertising revenue reached new highs, it’s a bigger concern now.

ADVERTISEMENT
“You look at Facebook and you say, ‘Wow, something really changed in 2014, If kids are starting to use so much of their daily time on messaging apps, surely it’s going to hurt somebody.”

Among 13- to 17 year-olds, Twitter usage climbed 2 percentage points to 48%, according to the report.

While more people use Facebook and its messaging app than any competitor, its user base tends to be older, with 55% of Facebook Messenger users being 37 or younger. By the same measure, 86% of Snapchat users and 83% of Kik Interactive Inc.’s users are under 37. Facebook sought to buy Snapchat in 2013 for more than $3 billion, and was rebuffed.

Trust, Fun
One reason for the decline in teen Facebook usage is due to concerns that the service may not be trustworthy. Just 9% of those surveyed described the website as “safe” or “trustworthy,” while almost 30% of people said they would use those words to describe Pinterest. Pinterest also ranked higher in “fun,” with 40% saying so compared with 18% for Facebook, as did Instagram, which Facebook owns.

Instagram Gains
Facebook CEO Mark Zuckerberg has been working to diversify the company’s offering beyond the main Facebook application. He acquired Instagram, the photo-sharing application, in 2012 for less than $1 billion. This year, Facebook also purchased messaging application WhatsApp Inc. for about $18 billion.

The Instagram purchase is showing gains, with Citigroup Inc. estimating the app is worth $35 billion, due to its faster-than-anticipated user growth. Instagram is especially popular among younger users, too.

Though Facebook has said it is in no rush to make money off of the app, Instagram CEO Kevin Systrom has been taking steps to make the service more appealing to advertisers. The company recently started eliminating spam accounts, wiping off large portions of fake followers for celebrities on the service such as Justin Bieber, which some have dubbed an “Instagram Rapture.”

“Not only is Instagram’s audience now larger than Twitter, but its users are about 1.8 times more engaged, and user growth has been greater,” Mark May, an analyst at Citigroup, wrote in a note. “Instagram is at the early stages of rolling out advertising, but we believe brands have and will find it an effective channel.”

Sunday, December 21, 2014

M2M : Electricity and Gas Smart metering in Europe

Taken from Berg's Report 


EU28+2 has 281 million metered electricity customers and the annual demand for electricity meters for new installations and replacements is in the range of 12–16 million units. Penetration for smart meters, providing more comprehensive functionality than basic meter data collections, was 24 % at the end of 2014. By 2020, Berg Insight projects that the penetration rate will increase to 58 %, driven by large rollouts in Spain, France and the UK, in combination with nationwide rollouts in several smaller countries. The installed base of smart electricity meters is forecasted to grow at a CAGR  of 15.8 % between 2014 and 2020 to reach 163.8 million units at the end of the period. The rate of installations is expected to accelerate towards the end of the decade as nationwide rollouts in France and eventually also the UK get underway. Berg Insight also anticipates that deployments of a new generation of smart meters will start in Italy by circa 2020 as the first intelligent metering devices installed in the country reach the end of their technical lifespan. Moreover an uptake in adoption in Germany is likely, although full-scale installations cannot be expected to begin before the mid-2020s.

Europe’s national governments play a key role for the adoption of smart metering. The EU’s highly publicised 20/20/20 targets merely include a recommendation for the member states to evaluate the technology and introduce it – if there is a positive business case. Over the past years, almost all European countries have performed cost benefit analyses of smart metering and the majority of the cases have resulted in a recommendation to go ahead with a rollout. Italy and Sweden were the first countries in Europe to complete smart meter rollouts in the late 2000s, followed by Finland at the end of 2013. A second wave of deployments is now prepared or underway in France, the Netherlands, Spain, the UK and several other countries in Western Europe. Estonia is doing the first nationwide rollout in Eastern Europe, where other markets with a high level of activity also include Poland and Latvia. At the end of 2014, a total of seventeen European countries had developed regulatory roadmaps for the full-scale introduction of smart meters and at least two more were planning for partial rollouts. Among the largest countries, only Germany remains indecisive about smart meters. The official position of Germany’s federal government is that the country should design the roll-out of smart metering systems in a targeted fashion which meets the needs of its energy reforms. A proposed plan for a partial rollout to around 30 percent of the households is currently being evaluated. If approved, Berg Insight believes that it could result in a gradual ramp-up of smart meter deployments in the late 2010s and full-scale replacements beyond 2020.

Smart gas metering is starting to take off in Europe as a number of countries have identified a positive business case for the technology. Seven countries – Austria, France, Ireland, Italy, Luxembourg, the Netherlands and the UK – have made positive assessments in their national cost benefits analyses and plan full-scale rollouts. The Netherlands made the installation of smart gas meters mandatory for new connections and replacements in 2012 and the UK has also started with replacements on a small scale. During 2015, large-scale installations are planned to begin in France and Italy as well. At the end of 2014, there were 2.5 million smart gas meters in operation, corresponding to a penetration rate of around 2 %. By 2020, Berg Insight projects that the rate will increase to 40 %, mainly driven by nationwide rollouts in the UK, Italy and France. The installed base of smart gas meters is forecasted to grow at a compound annual growth rate of 63.8 % between 2014 and 2020 to reach 49.0 million units at the end of the period. 

Mobile "currently" is taking over "almost" everything


Taken from eMarketers artcle's Digital Video Viewers Keep Eyes on PCs

Mobile hasn't taken over digital video

The US audience for digital video will pass 200 million in 2015, making up not quite two-thirds of the entire population. eMarketers estimate that growth will run in the low single digits over the next few years.


The most common screen for digital video consumption is the traditional desktop or laptop. Many digital video viewers use multiple screens over time (and even simultaneously), but computers remain the most popular access point. 

A survey of US internet users by HUB Research found that use of mobile devices (and smart TVs) for video viewing grew in 2014, but significantly more respondents still used computers to do so. Similar patterns can be seen in data from TNS, which found that laptop computers were the most common device used to stream videos. TNS’s survey showed a much smaller—but still significant—gap between computers and other devices for video viewing.


Another view, this from server data gathered by Adobe, in Q1 2014, almost three-quarters of US digital video starts occurred on computers, while just over one-quarter occurred on mobile devices. eMarketer estimates that there will be 89.7 million smartphone video viewers in the US in 2014. That total is about half the size of the overall digital video audience.

Although there are fewer tablet users than smartphone users, the size of the US tablet video-viewing audience is nearly as large as that of the smartphone video-viewing audience, reflecting the fact that the tablet is associated with leisure-time activities such as content consumption.

This year, about 46% of US households will have some form of connected TV (defined as a TV set connected to the internet through built-in internet capability or through another device such as a Blu-ray player, game console or set-top box—e.g., Apple TV, Google Chromecast, Roku). And by next year, nearly 56% of households will have at least one connected TV.

While the size of the mobile audience is considerable, the numbers also point to how nonmobile video—computers and connected TV—is still going strong. That’s essential to keep in mind when planning and executing ad campaigns to balance against the hype that “mobile is taking over everything.”

----

Related with that, another article from the same source, tell us a China market

China Beats US for Mobile TV Episode Viewing
Over 70% of China's smartphone owners watch full TV shows on their phones at least weekly

Mobile users in China are far more likely than those in the US to turn to their devices for TV viewing, according to August 2014 polling by GfK for the Interactive Advertising Bureau (IAB). The study found that 71% of smartphone owners in China watched full-length TV episodes at least weekly on their advanced handsets, and 27% did this once a day or more, compared with respective response rates of 28% and 9% for the US. Less than 10% of respondents from China never watched on a smartphone, compared with half in the US.


Full-length show consumption on tablets was also much more popular in China, where more than three-quarters of users watched at least weekly, compared with 36% who did so in the US. In terms of daily usage, 23% of tablet owners in China viewed full television episodes on their devices once a day or more, compared with just 5% in the US. Tablet owners in China were even less likely than smartphone users to never watch full shows on their tablets, at 6%. Meanwhile, 37% of US tablet owners never viewed complete episodes on their devices—lower than the response for smartphones, but still far behind China. Full-episode watching isn’t the only television activity that’s more mobile in China than the US. IAB reported that China’s mobile owners were more likely than those in the US to conduct TV-related activities in general on their devices, at least at home. Nearly half (47%) of smartphone users in China had performed a TV-related activity or watched TV on their phones while at home in the month leading up to polling, and the majority (54%) of tablet owners in the country had done the same. Meanwhile, rates for the US came in at 30% and 43%, respectively.

(Red : Maybe it has a correlation with device Operating System, that maybe most of people in China using Android based tablet or smartphone that have many free app to watching TV activities compared with people in US that use IOS based smartphone or tablet.)


Monday, December 15, 2014

Indonesia "still" The Leading Country for Digital Ad Spending Growth


This posting is updated the previous posting on August 2014,
Indonesia The Leading Country for Digital Ad Spending Growth

eMarketer's current update release a few days ago,
APAC Digital Ad Spending to Jump Over 30% This Year
Dec-2014

China dominates digital ad market; Indonesia sees most impressive growth

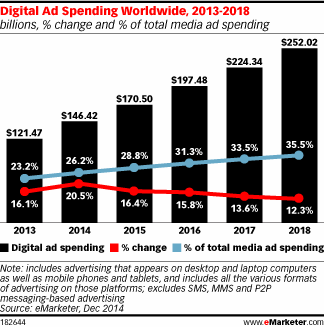
Digital advertising spend in Asia-Pacific is expected to rise 30.3% to total $46.59 billion this year, according to eMarketer’s latest estimates of digital ad spending worldwide. (red: previously it is expected to $41.07 billion, though the number of growth seems to be inconsistent)


Just like in 2012 and 2013, the region will boast the second-biggest share of digital ad spending worldwide, trailing only North America, at 31.8% vs. 37.3% (correction from 29.3% vs. 38.8%). This trend will continue through 2016, though Asia-Pacific will gain share during that period at the expense of North America. In 2017, Asia-Pacific will pass North America in total digital ad spending share worldwide, at 36.9% vs. 35.7%.

With investments in online and mobile advertising totaling $23.70 billion this year (updated from $18.96), China will maintain the largest share of the region’s digital ad market, at 50.9% (updated from 46.2%)—a trend that will continue through 2018. Japan and Australia will rank second and third, with respective digital ad spending totals of $9.07 billion and $4.52 billion this year, eMarketer estimates.


In Asia-Pacific, Indonesia will be the leading country for digital ad spending growth by a long shot, at a whopping 98.0% this year (updated from 75%). Indonesia sits at the bottom when it comes to digital ad spending, as brands there still heavily invest in traditional media like TV and print. However, as internet and smartphone adoption continue to grow rapidly, marketers will continue to switch ad spend to digital channels. Over the course of the forecast period, eMarketer expects the country to surpass India and South Korea in digital ad dollars by 2016 and 2018, respectively.

China will also see impressive digital ad spending growth of 45.0% this year, which will be mainly driven by phenomenal gains in the country’s mobile ad market. According to eMarketer’s latest estimates, marketers will spend $6.39 billion on mobile ads in China in 2014, up 600.0% from just $913.0 million last year.

$24Billion for Indonesia's Broadband Expansion

taken from the Reuters.com's article

Telkom to lead Indonesia's $24 billion broadband expansion
FRANSISKA NANGOY AND EVELINE DANUBRATA
JAKARTA Thu Dec 11, 2014 


(Reuters) - State-owned telecom firm PT Telekomunikasi Indonesia Tbk will take the lead in a $24 billion drive to expand Indonesia's broadband capacity over the next five years.

Rudiantara said the government is considering extending unspecified incentives to the company as it seeks to improve Internet access in Southeast Asia's largest economy. "I'm in the position to support Telkom to take a lead on this broadband plan," he told Reuters. The government is in the process of finalizing the details of the plan, he added.

Only 12%  of Indonesia's total population had access to mobile broadband last year, and that was at a relatively slow speed of 512 kbps , according to ministry data. For fixed line broadband, access was even lower at 5% of the total population.

Faster Internet and better access would give a boost to Indonesia's nascent e-commerce market, which the minister estimated could more than double to $25 billion by 2016 from around $12 billion this year.

Rudiantara said the government was discussing incentives with local e-commerce companies such as PT Tokopedia, but he declined to give further details. In October, Japanese technology giant SoftBank Corp and U.S. venture capital firm Sequoia Capital announced a $100 million investment in Tokopedia.

The minister also said the government was considering new regulations for the telecom industry to deal with an anticipated wave of consolidation as companies.  Rudiantara said he expects the number of telecom operators in Indonesia to more than halve to four in the next decade.

A price war to gain subscribers over the last few years and the high operating costs have squeezed the profits of telecom firms including Telkom, PT Indosat Tbk and PT XL Axiata Tbk. XL Axiata, part of Malaysia's Axiata Group Bhd, acquired mobile phone operator PT Axis Telekom Indonesia for $865 million earlier this year. In October, XL Axiata said it will sell 3,500 towers to telecom infrastructure firm PT Solusi Tunas Pratama Tbk in a 5.6 trillion rupiah ($460 million) deal.

Tuesday, December 09, 2014

UGC Streaming Vs TV

Taken from Business Insider's Chart of the Day
YouTube's Revenue Is Catching Up With TV Networks
By Dave Smith, Dec. 8, 2014

Speaking at Business Insider’s IGNITION Conference last week, IAC chairman Barry Diller predicted a major shakeup in the cable and satellite TV model within the next five to 10 years. It looks like digital streaming is already beginning to catch up to traditional TV networks, at least in terms of revenue.

YouTube’s annual ad revenue has been rapidly catching up to that of CBS, one of the biggest and most lucrative TV networks, and has more than twice as much revenue as AMC, which owns several popular shows including “Breaking Bad” and “The Walking Dead.” But CBS hopes to maintain and increase its lead over YouTube by embracing a new model: the company recently announced it’ll have a streaming subscription service available next year that’ll let you watch shows for a monthly fee, similar to Netflix.

Saturday, December 06, 2014

E-Commerce SE Asian profile

Taken from Nielsen's Report
SOUTHEAST ASIAN CONSUMERS FLOCK ONLINE TO PURCHASE PRODUCTS AND SERVICES

Consumers across Southeast Asia are going online in droves, particularly with the rapid up-take of connected devices, and they are increasingly searching out online channels to research and purchase the products and services they need and want. The growth of connected device ownership across Southeast Asia is laying the foundation for a booming online retail sector, with the number of consumers in the region making online purchases increasing significantly in the past two years. Online shopping is set to continue its upward trajectory in the years ahead as consumers’ familiarity with, and trust in, online retail sites grows.

Digital consumers across Southeast Asia enjoy going online to shop, although Filipinos, Vietnamese and Singaporeans are most inclined to purchase items online, while in Indonesia, Malaysia and Thailand consumers are more likely to go online to browse. Reading online reviews, product research and convenience rank among the main factors motivating consumers in Southeast Asia to go online to shop. Notably, a large proportion of Southeast Asian consumers also view the internet as a means of checking out products to inform their offline purchases. This trend, which signals a need for retailers to ensure they do not neglect digital as part of their overall engagement strategy, was most prominent in Indonesia, the Philippines and Singapore where a large number of consumers often look at products online before purchasing them in a store.

Travel services such as airline tickets and tour and hotel reservations are the most commonly purchased items online in Southeast Asia, along with tickets for events such as movies, live performances, exhibitions and sports games. Singaporeans have the highest online purchasing intention globally for airline tickets and hotel and tour reservations, and second highest globally for event tickets; around seven in 10 Singaporeans plan to go online to purchase flights (70%) and make hotel and tour reservations (69%) within the next six months. Malaysians’ online purchase intent is also high, with Malaysia ranking second globally for tours and hotel reservations and third globally for intention to purchase airline tickets and event tickets online. Around half of consumers in Indonesia, the Philippines and Vietnam intend to make travel and event purchases online, along with approximately four in 10 consumers in Thailand.

As e-commerce retailers’ product and service offerings have evolved to meet the demands of online shoppers, the categories which rank most favourably for online shopping have shifted substantially in the past two years; in 2012 categories such as computer and gaming software, mobile phones and clothing and accessories ranked among the most frequently purchased items online. While these categories continue to enjoy high engagement with Southeast Asian consumers when it comes to browsing, the conversion from looking to buying has dropped behind other categories in the past two years.

As Southeast Asian consumers become more familiar with online retailing environments, they are looking to broaden the number of tools and apps they use, both as a means of making their shopping experience easier and more convenient, and also to seek out the best deals. Emerging e-commerce capabilities such as grocery list apps and tools and discount alert apps are beginning to gain traction across the region, particularly in Thailand and Vietnam. More than half of Vietnamese netizens (56%) said they use price-saving apps in-store and when planning their shopping trips, and 44 percent manage their grocery list with grocery retailers’ mobile apps and online tools. In Thailand 55 percent use price-saving apps when planning their shopping trips, 44 percent use price-saving apps in-store and 40 percent use grocery retailers’ mobile apps and online tools to manage their grocery list.

Credit card security remains a key concern for consumers across the region with five of the six Southeast Asia markets ranking above the global average with respect to their concern around providing credit card information online. Filipinos are the most cautious when it comes to paying online by credit card (67% do not trust giving their credit card information online), followed by Thais (62%), Indonesians (60%), Vietnamese (55%), Malaysians (52%) and Singaporeans (41%), compared to 49 percent of consumers globally. In order to gain the trust of consumers online retailers must look for opportunities to provide reassurances around online payment security.

When it comes to devices most frequently used to shop online, although PCs dominate in the majority of Southeast Asia markets, use of mobile phones for online shopping is growing in popularity across the region. Increasing connected device ownership in Southeast Asia is by far one of the most significant factors driving the growth of online shopping, and rising affluence, availability of high-speed connectivity and evolving online offerings will compound this effect in the years ahead. The Philippines, Indonesia, Vietnam and Thailand rank in the top 10 markets globally for use of a mobile phone to shop online and all Southeast Asia markets scored above the global average. Tablet usage is also gaining traction as a means of accessing online retail sites, with all Southeast Asia markets except Singapore ranking above the global average for use of a tablet to shop online.

Insights contained in this article are taken from The Nielsen Global Survey of E-Commerce which was conducted between 17 February and 7 March 2014 and polled more than 30,000 online consumers in 60 countries throughout Asia Pacific, Europe, Latin America, the Middle East, Africa and North America.

Tuesday, December 02, 2014

App Business Model


Taken from Vision Mobile brochure of report
App Profits and Costs : The ingredients of a successful app business and how to replicate them

Insight

  • 63% of app developers and companies that care about revenues are below the profit line. 24% of developers make a definite loss and another 39% struggle around breaking even or slightly above that.
  • South Asia stands out as the region with the highest share (37%) of profitable app businesses. West Europe has the highest share of loss-making app businesses, while South America has the largest occurrence of struggling developers (48%). As contract work is gaining ground in South America, the prospects for healthy profits in the region are improving.
  • iOS has the largest share of profitable developers (41%) across all platforms. Surprisingly, iOS also has the most developers (19%) whose losses are in the ‘deep red’, i.e. below the $2,000 per app/month mark.
  • There is a chasm between the revenue models of the old, such as pay-per-download and in-app advertising, and of the new, such as e-commerce and affiliate programs. E-commerce is the most lucrative revenue model at $2,750 in revenues on average per app / month, and also the most profitable; 52% of developers using e-Commerce revenue models report comfortable profits.
  • Guns For Hire (developing apps on commission) are the most profitable developer segment, as 54% of Guns For Hire make more than $2,000 per app per month. Product Extenders (non-mobile business extending to apps) are the biggest spenders, their median expenditures reaching $2,400 per app per month.

There is a chasm between the revenue models of the old, such as pay-per-download and in-app advertising, and of the new, such as e-commerce and affiliate programs. E-commerce is the most lucrative revenue model at $2,750 in revenues on average per app / month, and also the most profitable; 52% of developers using e-Commerce revenue models report comfortable profits

Monday, December 01, 2014

Number of Internet user in Indonesia will reach the top five

Taken from eMarketer's article

Internet to Hit 3 Billion Users in 2015
and
India Rivals US as No. 2 Internet Audience

Nearly half the world's population will have regular access to the web by 2018

The number of internet users worldwide will surpass 3 billion in 2015, according to new figures from eMarketer, increasing 6.2% next year to reach 42.4% of the entire world's population.


This year, the internet will reach more than two in five people in the world for the first time as online audience hits 2.89 billion users globally. By 2018, eMarketer estimates, nearly half the world's population, or 3.6 billion people, will access the internet at least once each month.

"Inexpensive mobile phones and mobile broadband connections are driving internet access and usage in countries where fixed internet has been out of reach for consumers, whether that's due to lack of infrastructure or affordability," said Monica Peart, senior forecasting analyst at eMarketer. "While highly developed markets are nearly saturated in terms of internet users, there's significant room for growth in emerging ones; for example, India and Indonesia will both see double-digit growth in each year between now and 2018." (Later eMarketer updated the Indonesia annual growth year 2017 and 2018)


On a country-by-country basis, here are year-by-year other milestones eMarketer anticipates during our forecast period:
2014: Brazil will supplant Japan as fourth-largest internet user population
2015: Mexico will settle firmly into the eighth spot, eclipsing Germany
2016: India will jump the US as the second-largest internet user population
2017: Indonesia will reach the top five, overtaking Japan
2018: China will eclipse three-quarters of a billion users, after showing accelerating growth in each year in our forecast

Indonesia will surpass Japan but remain behind Brazil

In Indonesia, eMarketer already estimates penetration is higher than it will be in India by the end of forecast period. But that also means slower growth in the country, which has the fourth-largest overall population and the sixth-largest internet population this year.


Destined to outpace Japan, but not Brazil, in internet market size by 2017, Indonesia will continue to grow its internet penetration until reaching nearly 47% in 2018. Double-digit growth will be over, however, by 2016, when about two in five residents is online.

While substantial compared to most other countries in the world, the Indian and Indonesian internet markets will continue to be dwarfed by China’s for the foreseeable future.